Key elements of high-performing deposit return systems:
#4 - Convenient redemption system for consumers
In this System Spotlight article series, TOMRA provides adeep dive into the best practices of high-performing container deposit returnschemes.
Ocean plastic pollution, waste management costs and mandated collection targets are causing more and more governments to make sustainable resource management a priority. One policy that is actively being discussed is the concept of giving waste a value, to incentivize the public to collect it for recycling. This is a particularly popular approach for the items that are most commonly littered and found in oceans, such as beverage containers. Container deposit return systems (or “bottle bills”) add a deposit on the container on top of the price for the beverage, which is repaid when the consumer returns it to be recycled. A number of states or countries have committed to update existing deposit systems or develop new systems. In this ongoing article series and its white paper, "Rewarding Recycling: Learnings From the World's Highest-Performing Deposit Return Systems", TOMRA explores the best practices that separate the leaders in deposit return systems from the laggards.
Key element #4: convenient redemption system for consumers
Click here to view a webinar presentation on this topic.
The term “deposit return” is made up of two distinct but inseparable parts: the deposit value that engages the consumer, and the actual return of beverage containers for recycling. High-performing deposit return systems make the return and redemption of containers easy for the consumer, by making it as accessible as it was to purchase the beverage in the first place.
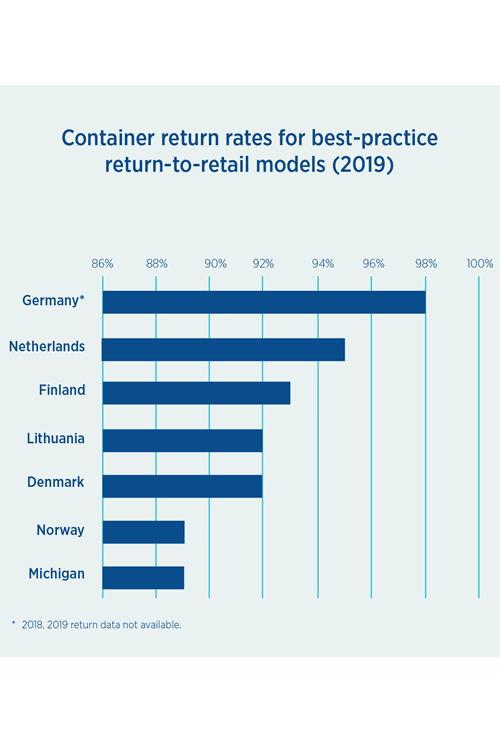
 “Return to retail” refers to a feature of deposit return legislation whereby retailers who sell beverages are also required to take back empty containers for recycling. All the major high-performing deposit return systems utilize return-to-retail collection, achieving an average return rate of 92%.1 In 2019 the average return rate for deposit systems with return-to-retail obligations was 88%, compared to 77% in systems in which retailers are not involved.2
When consumers are charged a deposit on a container, a promise is made that they will be able to recoup their money. It is the obligation of producers, retailers and the government to ensure this is possible, otherwise the deposit risks becoming an unauthorized tax or eco-fee. Effective deposit return systems not only consider cost effectiveness in the design of a DRS, but also the consumer’s experience and rights. This is what a return-to-retail network delivers.
A redemption system set up for success
High-performing systems do not allow design of collection point infrastructure and operations to be left to a central beverage industry-run administrator, due to potential conflicts of interest. The design of a redemption system design is either put in place at a legislative level (for example, a return-to-retail model) or an independent “network operator” is tasked with the specific system requirements, such as the number of collection points per capita, to split responsibility for system administration into two levels.
Measuring convenience
Although a metric for “convenience” does not exist yet in statute, high-performing programs are effectively providing consumers convenient locations to return their containers in parallel with retailer density. As data suggests below, a ratio of 1 point of return for every 355 – 1,100 people is effective. However, in areas with higher urban populations, deposit systems take a different approach in order to meet demand. In Norway, for example, the number of collection points per square kilometer is 0.3, but in the capital Oslo it is 11. Other metrics used to evaluate convenience include the return rate for the deposit return system, and the percentage of consumers that participate in the system.
| System | Norway | Lithuania | Germany | Michigan | California |
|---|---|---|---|---|---|
| Return rate | 92% | 92% | 98% | 89% | 62% |
| Return locations | 15,000 | 2,500 | 130,000 | 13,500 | 1219 |
| Population | 5,33m | 2,79m | 83,02m | 9,99m | 39,51m |
| Return point to consumer ratio | 1 : 355 | 1 : 1,117 | 1: 638 | 1: 739 | 1: 32,411 |
A system designed for efficient transportation logistics
Container compaction provides important value within deposit systems. When compacted or crushed, PET bottles are reduced in size to a ratio of about 2.5 : 1 and aluminum cans 6 : 1. This reduction in size saves space, reducing transportation costs and minimizing the risk of unauthorized redemption since crushed containers cannot be redeemed twice. The closer container compaction occurs to the point of redemption, the more fuel, carbon and money saved. As such, Norway and Sweden incentivize the use of RVMs that can compact containers by paying a higher amount to retailers who utilize such technology (by way of a higher “handling fee”).
Retailer participation
In most circumstances, retailers are paid what is known as a handling fee for their redemption services and, in high-performing systems, this is paid by the Central System Administrator (which is funded by the beverage industry) to the retailer on a per-container basis.3
Consumers may return deposit containers to any retailer in the network (known as “universal redemption”), and retailers take back containers similar to the types they sell. This benefits both retailers and consumers.
Retailers below a certain size might not be obligated to participate but can offer redemption services if they wish.
Redemption centers, depots, and/or kiosks
These locations provide deposit container collection alone and can play a role in redeeming containers by:
- Serving high-volume redeemers and consolidating volumes for operational efficiencies. Maintaining a minimum number of redemption points per population (e.g. one redemption point per 355 - 1,100 people).
- Providing redemption locations close to high-consumption points, like outdoor eateries and marketplaces.
- Providing unmanned redemption kiosks at retail locations including parking lots, to provide cost efficiency and convenience.
Why a return-to-retail approach leads to high performance
Consumer’s perspective

- Convenient redemption options: A 2020 poll by Ipsos, commissioned by the Boomerang Alliance, of consumers in Victoria, Australia, found that 71% of respondents preferred container refund points in supermarkets or shopping centers.4
- No extra trips required, and additional travel time eliminated: Having container return facilities in locations that people already visit regularly can change the mindset of “going out of your way” to recycle. US consumers already visit grocery stores about three times a week for food shopping.5
- Ability to redeem containers while “on the go”: Having a high number of redemption points makes redemption easier for beverage containers consumed on the go. One US study estimates the percentage of on-the-go consumption between 30-50% of all US beverage container consumption.6
- Frequent recycling without waiting is possible: With many supermarkets and grocery stores available, consumers can access multiple return points locally. This helps to spread the return volume across the network, reducing or eliminating wait times. More than 80% of respondents to a survey in Norway said having easy access to a return point without waiting was extremely important in returning their containers.7
Government’s perspective
- Addressing plastics pollution: Beverage container litter as a proportion of all litter is 66% less in regions with a DRS than in those regions without.8 With an average return rate for return-to-retail deposit systems of 88%, vs 77% in systems that do not involve retailers, there is evidence that retailers may play a significant role in reducing plastic pollution.9
- Achieving targets: With regions (in particular, EU member states) seeking to achieve ambitious recycling, collection and recycled content targets, deposit return has been recognized as a reliable way to achieve high performance. The Government of Ireland commissioned a study to evaluate pathways to meet the EU’s 90% collection target for plastic bottles. The authors stated that “no evidence has been presented to suggest that the current (waste management) system could be enhanced to reliably achieve a 90% separate collection rate. On the basis of this study, a DRS is a feasible option for Ireland, and indeed the only way in which it can confidently be asserted that a 90% collection rate for plastic beverage bottles can be achieved.” The study also recommended return to retail, because such models “generally have higher return rates.”10
- Ensuring convenience: As stated above, since retailers are already located to provide convenient access to purchasing products, they are uniquely positioned to offer convenient return options.
- Immediate results: Governments and producers see utilizing existing retail infrastructure for a DRS as a way to help accelerate progress on collection and waste reduction. After a return-to-retail-based DRS was introduced in Lithuania, beverage container return rates rose from 34% to 92% in less than two years.11
Producer’s perspective
- Leverage an existing network: Building on existing logistics networks and infrastructure used by retailers can form an efficient reverse logistics system. Supermarkets are usually located within residential areas, which means the infrastructure for convenient redemption is already in place. A return-to-retail approach reduces the need to get permits for, build and outfit new recycling locations, allowing the DRS to be launched faster, and more cost effectively.
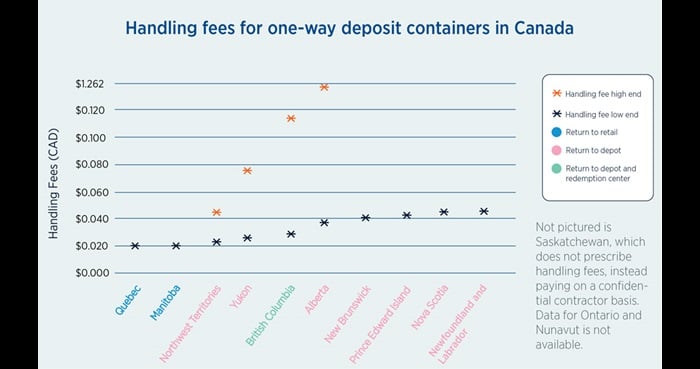
Supermarket chains typically have networks across whole regions, even in remote communities, and already accommodate truck for delivery of goods. These trucks could also be used for reversing the logistics or consolidating pick-up and transportation services. - Cost-effective approach: Off-retail redemption centers tend to incur higher and increasing costs, due to factors such as labor and site maintenance, among others. In a retail environment, the cost of redemption offers a marginal increase because other businesses are sharing those costs and labor. Handling fees can be viewed as a proxy for the cost of redemption. The two provinces in Canada that operate return-to-retail models also have the lowest handling fees, contributing to a more cost-effective system.
Retailer’s perspective
- Consumers spend deposit money at retailers: Offering the facilities to redeem cans and bottles at a retail location gives the consumer a reason to visit and spend their deposit money in stores. Almost three-quarters of Michigan consumers (73%) who participated in a survey said they spend their deposit refund at the store where they returned their containers. Estimates in other markets are as high as 95%.12 Shoppers returning containers across four European countries also stated that they spent up to 50% more money during their store visit than those who did not return empties.
- Many retailers today are also brand owners selling their own private label: In this case they share the “Producer’s perspective” above.
- Positive environmental impact and brand image: Retailers can track data on how many containers they collect and recycle every year, to tell a brand story that supports their Corporate Social Responsibility commitments. Offering a redemption service for container recycling also provides a regular reminder to consumers that retailers practice environmental stewardship. In 2020, the retailer Lidl launched a large advertising campaign in Germany to promote how containers returned by customers to the chain’s more than 6,200 RVMs are recycled into new bottles. This has enabled the store’s private-label water brand to manufacture new bottles out of a minimum average of 50% recycled content.13
System Spotlight
Michigan, USA
Michigan’s DRS has collected 96% of the 150 billion deposit containers sold since its DRS was introduced more than 40 years ago.14 The state offers retailers provisions such as limiting the number of containers that any one consumer can redeem per day (250) and only requires retailers to take back brands that they sell (though the latter can cause consumer confusion). This aims to help retailers manage the redemption volume while providing consumers with convenient access to redemption. A 2019 poll showed that 94% of Michigan respondents supported the deposit law.15
Norway
Across Norway, there are 15,000 redemption locations, equating to one redemption point for every 355 people.16 Of those locations, only 23% utilize RVMs; however, these account for the collection of 93% of returned containers. These RVMs allow the Central System Administrator, Infinitum, to make the transportation network as efficient as possible, due to container compaction and redemption data that predicts pick-up routes. In 2020, Norway achieved an 92% container return rate.17
California, USA
California is a perfect example of the impact of inconvenience on recycling performance. The state’s deposit system was built on a network of redemption centers, with no redemption obligations for retailers. Retailers are only obligated to redeem containers if their store is not located near a redemption center (or if a redemption center closes down, as is now the case).
Retailers can also opt out of redemption by paying US$100 (€88) per day, but this is largely unenforced. A rigid and outdated state funding formula has left redemption centers starved for cash, while at the same time materials prices plunge (which redemption centers are entitled to) and operating costs including minimum wage rise.
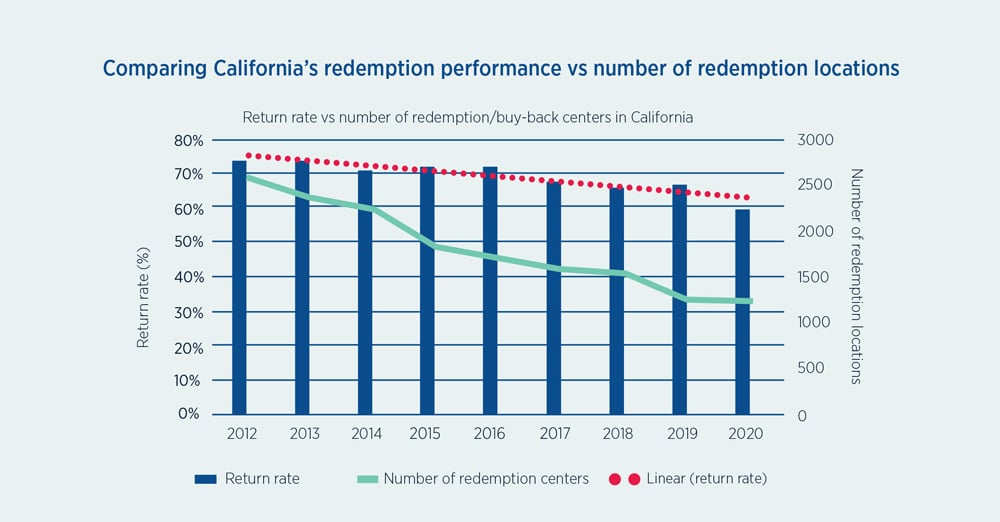
This has caused recycling centers to close en masse since 2013. Closures have left California with 1,219 recycling centers, less than half the 2,578 centers that were in operation in 2012.18 San Francisco has only one center to serve nearly 900,000 residents.19
Consumer convenience for redemption is key. The result is that Californian consumers have lost convenient access to a deposit redemption point, making deposits difficult to redeem and essentially turning the deposit into a tax. The deposit program’s recycling rate has fallen from 74% in 2013 to 62% in 2020 (which includes cans and bottles placed in curbside recycling bins).20
High-performing programs successfully engage consumers with a meaningful deposit value, but they also make returning containers as easy purchasing the beverages in the first place, to promote high collection rates. Given that the world’s highest performing programs utilize retailers in the return of containers, it’s clear this is a proven model for success. In addition, leveraging existing infrastructure helps governments and producers reach collection targets quickly and cost effectively. Flexibility for retailers, in the form of a healthy handling fee and varied redemption obligations (depending on size), promote fairness in the system. In this way, high-performing deposit return systems balance stakeholder interests while achieving superior recycling rates.
________________________
1 The top 10 highest-performing container deposit systems in the world as of 2019 are, in order: Germany (98%), Netherlands (95%), Finland (93%), Denmark (92%), Lithuania (92%), Palau (90%), Norway (89%), Croatia (89%), Michigan (89%), and Estonia and Iceland are tied with at 87%. All employ a return-to-retail model, with the exception of Iceland and Palau, which utilize a return-to depot model in part due to their extremely small populations and minimal retail infrastructure. “Global Deposit Book 2020,” Reloop. 2020.2 Compares return-to-retail-only markets with systems that do not rely on retailer redemption at all (return to redemption center or return to depot). Calculated based on “Global Deposit Book 2020,” Reloop. 2002.
3 “Global Deposit Book 2020,” Reloop. 2020.
4 “Boomerang Alliance launches ‘Recycle right Victoria’ CDS campaign,” Medianet.com.au. November 2020.
5 “It’s a new scene for grocery shopping as pandemic changes behaviors,” SupermarketNews.com. June 2020.
6 “Container Recycling Institute Releases Special 2013 Vermont Bottle Bill Report,” Container Recycling Institute and Vermont Public Interest Research Group. 2013.
7 “Profiling Shoppers in Norway, Finland and Holland,” TNS Gallup. 2003. Refers to 1,356 Norwegian retail deposit and non-deposit system user interviews.
8 “Understanding the effects of marine debris on wildlife,” CSIRO. 2014.
9 “Global Deposit Book 2020,” Reloop. 2020.
10 “Improving the Capture Rate of Single-Use Beverage Containers in Ireland,” Eunomia. 2019. Commissioned by the Government of Ireland, Department of Environment, Climate and Communications.
11 “Lithuania exceeds container return rate expectations as TOMRA supports new state of the art deposit systems,” TOMRA. June 2018.
12 “MRG Michigan Poll - Spring 2019,” Marketing Resource Group. May 2019. 73% represents those who indicated “all” or “most of the time”. Polled 600 likely voters statewide.
13 “'Saskia. This is how water works' Lidl starts campaign for the bottle cycle,” Lidl.de. 2020. And “Our Promise: Old Bottles Become New Bottles,” Lidl.com.
14 For the majority of the history of Michigan’s deposit program, the redemption rate was above 95%. Most recent annual redemption rates are available via www.bottlebill.org.
15 “MRG Michigan Poll - Spring 2019,” Marketing Resource Group. May 2019.
16 “Infinitum,” ReloopPlatform.org. 2017. Accessed on January 16, 2020.
17 “Global Deposit Book 2020,” Reloop. 2020.
18 “California’s Beverage Container Recycling and Litter Reduction Program Fact Sheet,” California Environmental Protection Agency. 2013. 2020: “Beverage Container Recycling Centers,” CalRecycle.CA.Gov.
19 Consumer Watchdog. 2020.
20 “Redemption Rate For Empty Bottles And Cans Sinks To 60% As Consumers Forfeit $60 Million in Deposits Refunds,” Consumer Watchdog. 2020.